很多时候,我们会看到一些好的学术论文,在统计分析时,说我做了什么什么sensitivity analysis,也就是敏感性分析。这类分析,对于高分文章很重要,但真的懂的人、哪怕懂概念的人也不多,我今天借一篇文章来拓展开来了解了解。
所谓的敏感性分析,指的是一篇文章在主分析后,采用不同的统计方法,或采用不同的数据重新分析,来探讨分析结果的稳健性。如果采用不同的分析思路得到的结果与主分析方法结果不一致,则说明本文主分析结果不那么可靠。
这是一篇来自欧洲流行病学杂志的文章,采用队列研究方法,探讨的是日本人群戒烟与老年痴呆症发生率的关系。
文献摘要:
为了探讨日本老年人吸烟状况和戒烟年限与痴呆发病风险的关系。我们在一项前瞻性队列研究中对12489名年龄≥ 65岁并随访了5.7年的日本人中进行了吸烟状况和戒烟与痴呆的纵向分析。
2006年通过问卷调查收集了关于吸烟状况和其他生活方式因素的信息,从公共长期护理保险数据库中检索了痴呆发病的数据。Cox比例风险模型用于估计痴呆发病的多变量调整风险比(HRs)和95%置信区间(95%CI)。
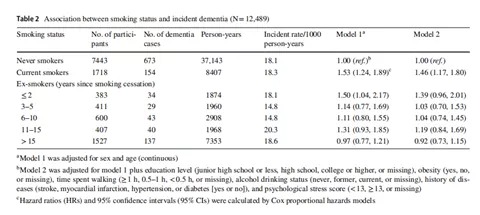
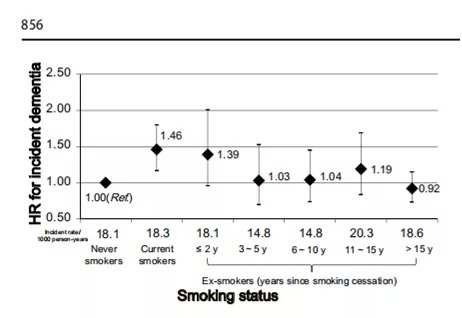
在61613人年的随访中,记录了1110例(8.9%)痴呆事件。与从未吸烟的人相比,目前的吸烟者患痴呆症的风险更高(HR 1.46,95%CI 1.17,1.80)。在已戒烟者中,戒烟≤ 2年的人的患痴呆症的风险仍然很高(HR 1.39,95%CI 0.96,2.01),但戒烟3年或更长时间可以降低患痴呆症的风险;戒烟3-5年的人的多变量HRs(95%CIs)为1.03 (0.70,1.53),戒烟6-10年的为1.04 (0.74,1.45),戒烟11-15年的为1.19 (0.84,1.69),戒烟15年以上的为0.92 (0.73,1.15)。
因此,研究表明戒烟3年以上的前吸烟者患痴呆症的风险将与从不吸烟者达到相同的水平。
案例分析:
该研究作为前瞻性队列研究,根据暴露与否或暴露程度不同主要分为3组:从不吸烟者、当前吸烟者或曾经吸烟者(其中曾经吸烟者又可以根据戒烟时长又分为6组),结局指标是痴呆症发病率。
该研究非RCT研究,存在混杂变量,而结局是二分类结局,随访时间被用作时间尺度。因此,多变量调整的Cox比例风险模型可根据吸烟状况计算痴呆事件的风险比(HRs)和95%置信区间(95% CIs)。其中吸烟状态组创建了虚拟变量,从不吸烟者被定义为对照组。
统计方法:
1. 首先,对暴露因素和协变量的设置进行了说明。
Participants were categorized as neversmokers, current smokers, or ex-smokers according to their responses on thequestionnaires at the baseline.
Covariates:obesity, time spentwalking per day, alcohol drinking status, education level, history of diseases(stroke, MI, hypertension, or diabetes), and psychological stress score.
郑老师:队列研究,必须清晰定义什么是暴露因素,有哪一些协变量参与到统计分析中,意味着它们可能是混杂变量。
2. 多变量调整的Cox比例风险模型用于根据吸烟状况计算痴呆事件的风险比(HRs)和95%置信区间(95% CIs)。
Model 1 was adjusted for sex and age(continuous),model 2 was further adjusted for obesity, time spent walking perday, alcohol drinking status, education level, history of diseases (stroke, MI, hypertension, or diabetes), and psychological stress score.
郑老师:Cox模型构建了两个,分别调整了不同类型的协变量。在队列研究中,构建多个回归模型是一般化的操作。
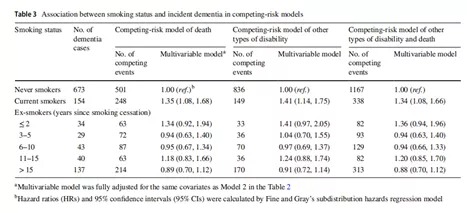
3. 应用竞争风险模型“捕捉”不同竞争事件的可能影响。
Smoking is a significant risk factor for death, and some severe diseases that can cause disability and death without disability, as well as non-dementia disability, were censored during follow-up before the onset of dementia in our study. Accordingly, it is necessary to examinethe possible influence of competing events on the association between smoking status and risk of incident dementia applying Fine and Gray’s subdistribution hazards regression model [34]. Competing events were defined as: (1) death without disability, (2) any other types of disability and (3) death and any other types of disability.
郑老师:竞争性风险模型,是Cox回归分析的特殊形式,也是亮点所在,因为研究对象很可能因为其他原因去世,这些人群的失访十分可惜,但采用Fine and Gray’s方法构建回归模型,则可以探讨,由于其他原因趋势对研究效应的影响。实际上,竞争性风险模型可以认为是敏感性的分析的手段。它的存在,既可以丰富题材,又可以研究COX回归计算得到HR的稳健性。
4. 敏感性分析
Four sets of sensitivity analyses wereundertaken.
郑老师:作者花了大量的精力来开展敏感性分析。本文列出了4种分析框架。
第一,
First, we analyzed whether the association would change if only individuals who had higher cognitive function at the baseline were selected.
郑老师:第一种框架,是数据不同,结果是否稳健,作者纳入了只有高认知功能得分的研究对象进入队列研究。
第二,
Second, we reanalyzed the association between smoking cessation and dementia by excluding participants whose dementia event occurred in the first 2 yearsof follow-up.
郑老师:第二种框架,也是数据不同,结果是否稳健,作者排除了最初随访2年内就发病的研究对象。
第一和第二种分析框架,讨论有没有可能因果关系颠倒带来偏倚,如果第一第二种与先前主方法不一致,则有理由怀疑主方法结果不可靠。
第三,
Third, we stratified participants according to sex, age (<75 years or ≥ 75 years), education level (< junior higher schoolor ≥ junior high school), history of stroke or MI (at least one of them), hypertension, and diabetes. Tests of interaction were also performed in terms of sex, age, education level, and history of diseases mentioned above.
郑老师:第三种框架,统计方法不同,结果是否稳健,作者可能怀疑存在着交互作用,因此进行分层分析探讨交互效应存在着的可能性。若有交互效应,那么主分析结果不那么可靠。
第四,
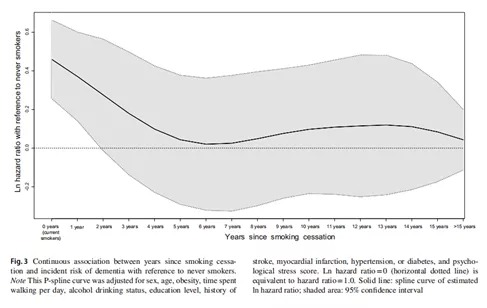
To explore further the continuous relationship between years since smoking cessation and incident risk ofdementia, penalized splines (P-splines) were used where automatic selection criteria for deciding the optimal degree of smoothing (or equivalently, theoptimal degrees of freedom) were implemented.
郑老师:应用P-样条曲线来呈现戒烟后的年数与多个协变量调整后的痴呆事件发生风险的连续关联。
这一敏感性分析,主要探讨戒烟时间与结局的非线性关系。一般可以基于趋势性的基础上进行分析,来判定线性趋势是否严格成立。
总的来说,在主分析的基础上,作者进行了多数据、多模型的分析,来评价分析结果,也就是HR和P值的稳健性。
统计分析结果
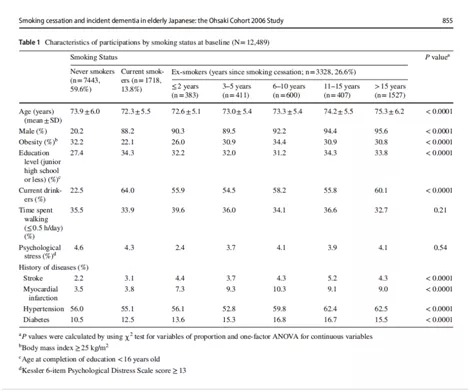
1. 研究对象基本特征
2.多重变量调整的Cox比例风险模型分析吸烟状况与痴呆发生风险的关系
3.竞争风险模型中吸烟状况和痴呆发生风险的关系
4. 戒烟后的年数与多个协变量调整后的痴呆事件风险的连续关联
