SourceTracker有什么用?
用途是可以识别相关各组间来源的分析,如具体的问题:
婴儿的肠道菌群有哪些继承了母亲的肠道菌群、哪些来自阴道菌群、哪些来自皮肤
法医学的应用,尸体中的菌群与来源土壤的鉴定、腐败菌来自本身,还是周围环境
河流污染物的来源分析、周围工厂、农田、养殖厂对河流污染的贡献和来源追溯。
分析植物菌组形成过程:植物根际菌在土壤中来源和种子来源;叶际菌群的土壤来源比例等。
软件简介
Bayesian community-wide culture-independent microbial source tracking 于2011年发表于Nature Methods
由圣地亚哥大学的Scott教授及Rob Knight团队合作完成。第一作者Dan Knights。
Google统计目前引用299次。
该软件中目标样本为Sink,微生物污染源或来源的样品为Source;基于贝叶斯算法,探究目标样本(Sink)中微生物污染源或来源(Source)的分析。根据Source样本和Sink样本的群落结构分布,来预测Sink样本中来源于各Source样本的组成比例。
我们之前解读过Rob Knight的一篇Sciences文章中图2A就使用此软件分析确定尸体腐败过程中主要菌来自于土壤的结果。
软件结果解读
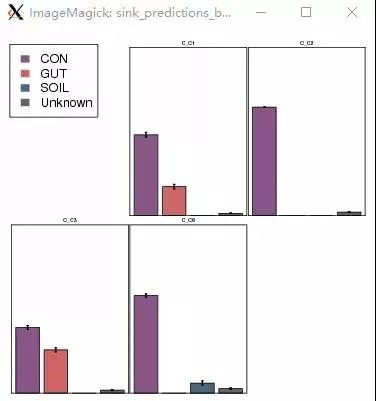
SourceTracker分析图a,预测样本来源比例柱状图。一幅图代表一个预测样本,用不同颜色的柱子表示该样本中各来源的比例,Unknow代表未知来源分类,误差线代表100次Gibbs采样的标准差。

SourceTracker分析图b,预测样本来源比例面积图。一幅图代表一个预测样本,不同颜色代表不同来源的比例,每一列代表一次Gibbs采样结果,100次Gibbs采样结果按照相近的排列顺序进行展示。
SourceTracker分析图c,预测样本来源比例饼图。一个饼图代表一个预测样本,不同颜色扇形的比例代表该预测样本中各来源的比例。
原文解读
DOI: 10.1038/nmeth.1650
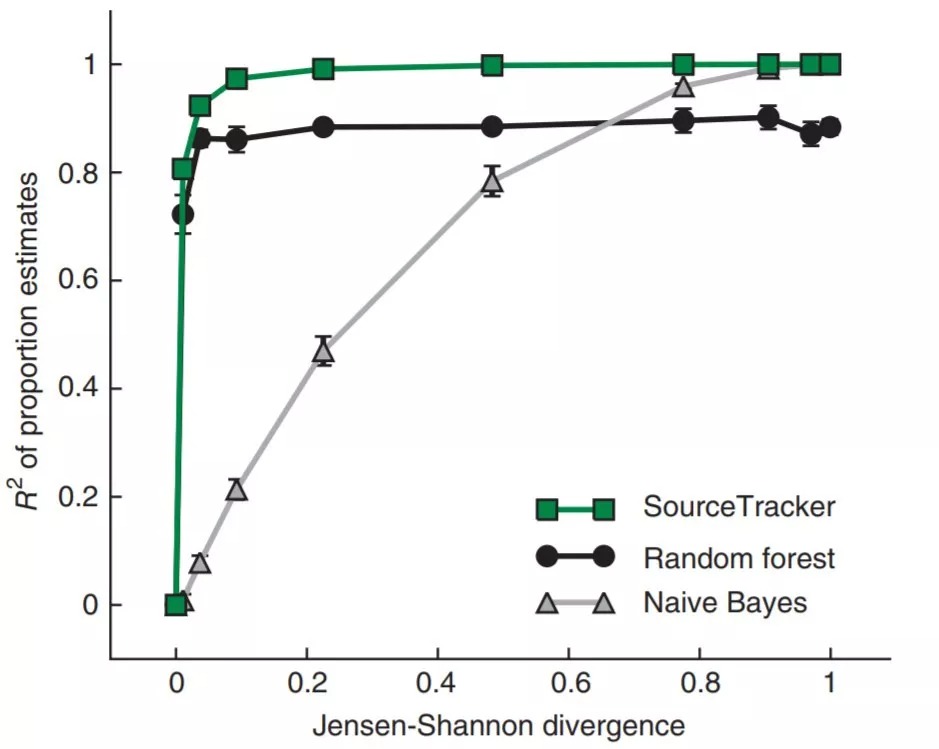
图1 SourceTracker和其他模型的比较。所示模型估计模拟样本中两个源环境的比例,Jensen-Shannon差异表示环境之间的重叠程度从0(完全相同,因此不可能消除歧义)到1(完全不重叠,因此容易区分)。绘制了估计比例的确定系数(r2)。每个点代表100个样本的三次试验的平均R2;误差条显示均值的标准误s.e.m.(n=3)。
Figure 1 | Comparison of SourceTracker and other models. Indicated models estimate the proportions of two source environments in simulated samples, as the degree of overlap between the environments was varied from a Jensen-Shannon divergence of 0 (completely identical and thus impossible to disambiguate) to 1 (completely non-overlapping and thus trivial to disambiguate). The coefficients of determination (R2) of the estimated proportions are plotted. Each point represents the mean R2 for three trials of 100 samples each; error bars show s.e.m. (n = 3).
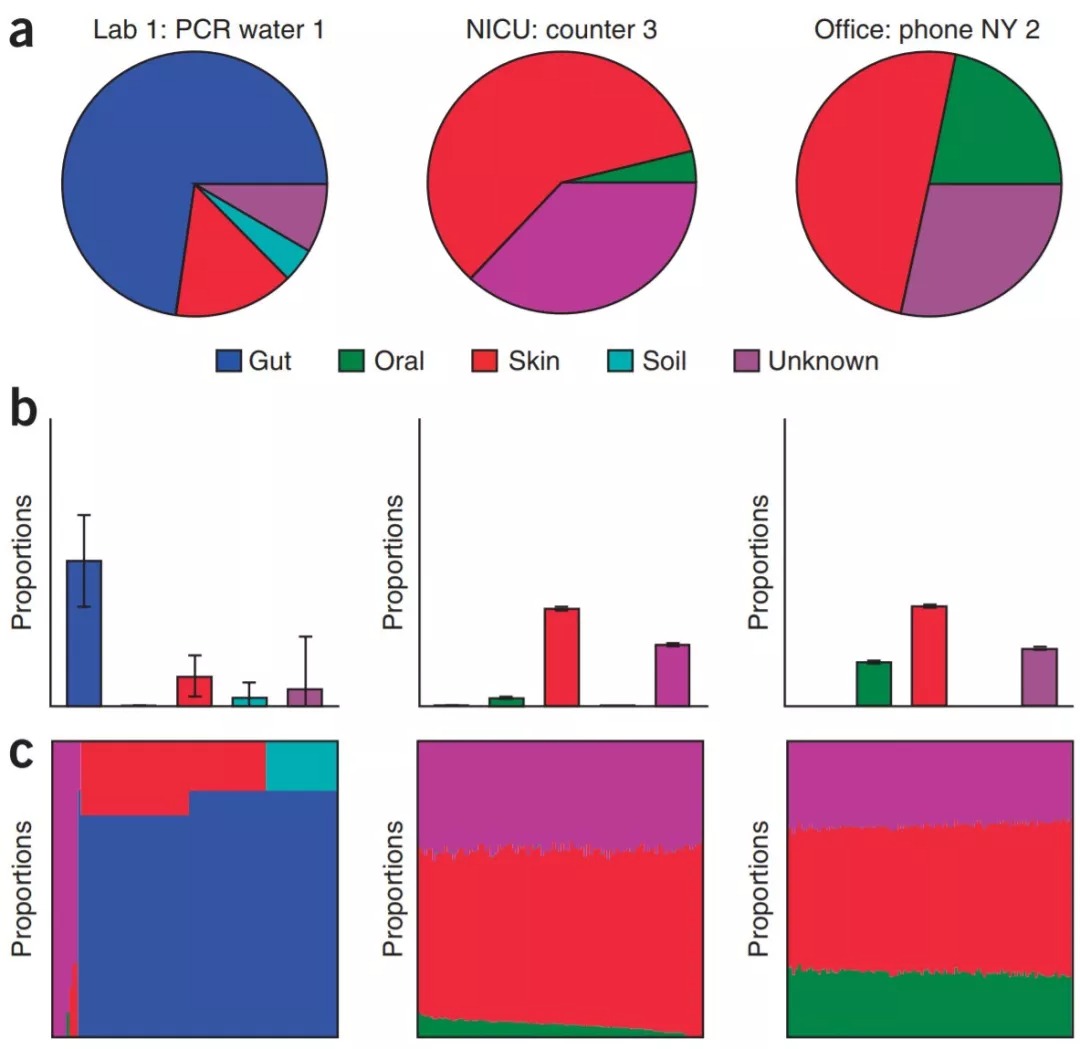
Nature Method [1]原文:每个图形代表一个样本Sink,分别是Lab1的PCR水、NICU桌子、办公室电话;不同颜色表示不同样本来源Source,所占面积为在Sink样本中各来源的比例。
图2. SourceTracker对洗碗池样本子集的比例估计。(a–c)使用SourceTracker估计的三个洗碗池样本的源环境比例,每个源环境中包括45个训练样本:吉布斯采样中100次取样的平均比例(a),相同样本的数据,包括比例估计的标准变异S.D.(b)。100次吉布斯绘制的可视化;每个列显示一次采样的结果,列按保持相似的混合物进行排列在一起,使图形看起来看美观、更容易观察和比较规律(c)。
Figure 2 | SourceTracker proportion estimates for a subset of sink samples. (a–c) Source environment proportions for three sink samples estimated using SourceTracker and 45 training samples from each source environment: mean proportions for 100 draws from Gibbs sampling (a), data for the same samples, including s.d. of the proportion estimates (b), and visualization of the 100 Gibbs draws; each column shows the mixture from one draw, with columns ordered to keep similar mixtures together (c).

图3 常见污染操作分类单元(OTU)的相对丰度。SourceTracker可以为水槽样本中的每个OTU观测序列分配不同的源环境。这十个OTU源对在水槽环境中具有最高的平均相对丰度,不包括未知源。图例给出了OTU的属级分类、OTU标识符和分配给这些观测的源环境。值得注意的是,被归类为肠杆菌的OTU,一种常见于肠道的谱系,在皮肤训练样本中比在肠道训练样本中更为普遍。
Figure 3 | Relative abundance of common contaminating operational taxonomic units (OTUs). SourceTracker may assign a different source environment to each observation (sequence) of an OTU in the sink samples. These ten OTU-source pairs had the highest average relative abundance across sink environments, excluding the unknown source. The legend gives the genus-level taxonomic classification of the OTU, the OTU identifier and the source environment assigned to these observations of the OTU. Note that the OTU classified as Enterobacter, a lineage commonly seen in the gut, was more prevalent in the skin training samples than the gut training samples.
文章实战解读
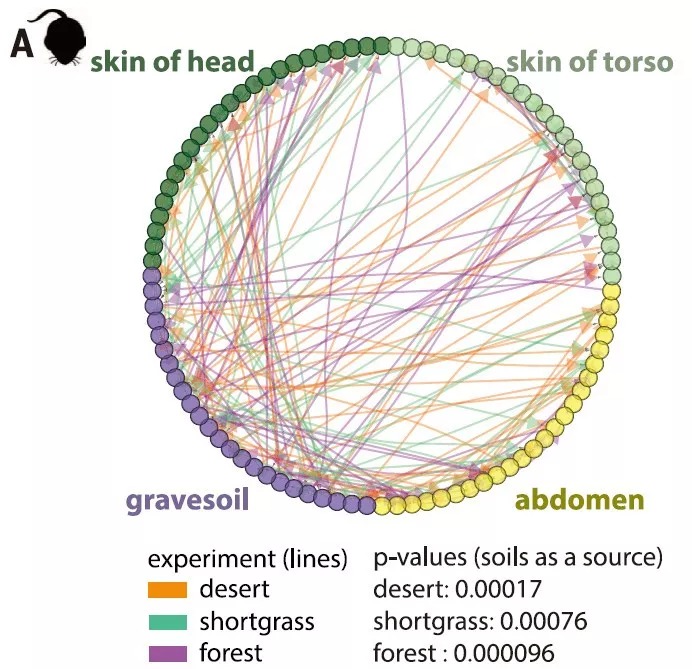
Rob Knight-2016-Sciences[2]文章中图(A) 动态贝叶斯推理网络: 尸体分解过程微生物分类群神经信息流动网络,土壤是其主要来源。小鼠尸体四种取样位置分别为头、躯干、腹部和土壤。颜色为3种环境,分别为沙漠、草地和森林,且均与土壤来源微生物非常显著相关。
更多内容,请阅读下文:
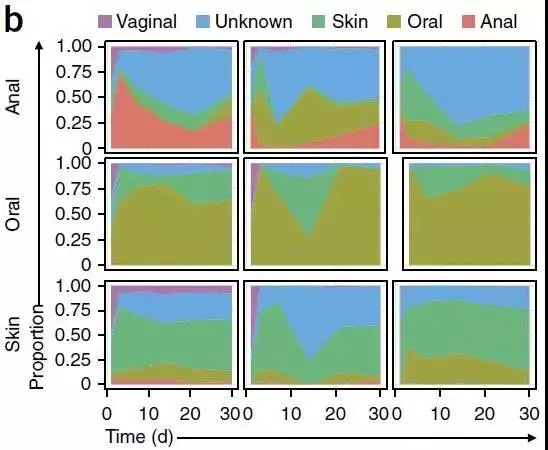
[3]产道菌群移植对剖腹产婴儿缺失菌群的恢复:图中展示了婴儿三个部位皮肤Skin、口腔Oral、肛门Anal中,肠道菌群组成的来源,随时间的推移1-30天而发生的改变。
剖腹产的婴儿患免疫和代谢疾病的风险增高,被认为可能由于缺乏了与母亲生殖道分泌物(包括微生物)的接触;母亲生殖道的分泌物会覆盖顺产婴儿的全身,促进了婴儿口腔、肠道、皮肤菌群的定殖,以及对婴儿的保护作用;对剖腹产婴儿涂抹分泌物,随时间推移,其各部位菌群特征逐渐趋向于顺产婴儿。该方法可以部分的恢复剖腹产婴儿菌群,但对健康的长期影响有待观察,以及样本量也需要扩大。
软件安装
SourceTracker是一个R脚本, 最新版本地址:https://github.com/danknights/sourcetracker ,版本1.0,2016年9月18日更新
# 下载脚本和测试数据
git clone git@github.com:danknights/sourcetracker.git
cd sourcetracker/
example.r使用data目录中的OTU表和mapping实现文章中的分析实例
# 运行测试数据
Rscript example.r
运行中显示如下结果:
Rarefying training data at 1000
                                              Gut              Oral            Skin            Soil         Unknown
..........   1 of  125, depth=   12:  0.12 (0.09)       0.07 (0.03)     0.11 (0.06)     0.02 (0.04)     0.68 (0.09)
..........   2 of  125, depth=   20:  0.22 (0.03)       0.08 (0.03)     0.29 (0.05)     0.03 (0.04)     0.39 (0.05)
..........   3 of  125, depth=   10:  0.60 (0.00)       0.00 (0.00)     0.25 (0.13)     0.00 (0.00)     0.15 (0.13)
..........   4 of  125, depth=   10:  0.28 (0.06)       0.09 (0.03)     0.03 (0.05)     0.01 (0.03)     0.59 (0.07)
.......... 5 of 125, depth= 2: 0.00 (0.00) 0.00 (0.00) 0.45 (0.16) 0.00 (0.00) 0.55 (0.16)先将训练样本抽平至1000条。再进行125次的重采样,来源包括肠、口腔、皮肤、土壤和未知五大类来源。结果为以上讲解的几种图形,建议在Rstudio中打开R脚本绘图,交互探索结果。
输入文件准备
按照data/metadata.txt标准的实验设计和data/otus.txt标准的OTU表,在example.r中修改对应的分组,即可分析自己的数据了,非常easy。最好按照示例的文件填写内容,减少代码修改直接运行,以下有实验设计信息说明:
实验设计
示例文件:data/metadata.txt
主要包括的列有:样品名、描述、环境Env、来源SourceSink、研究、细节
你的实验设计必须有前4列
#SampleID列:样品编号,以英文字母开头,最好只包括字母和数字,必须与OTU表行名一致Description列:样品名,即样本名称,可以包括空格,非字符,展示为图为标签方便阅读理解Env列:为样品来源注释列,包括上面输出的Gut、Oral、Skin、Soil,主要为采样来源SourceSink列,要计算的样品标Sink,而来源数据标Source
#SampleID       Description     Env     SourceSink      Study   Details
Run20100430_H2O-1       PCR water 1     Lab 1   sink    Lab 1   PCR_water_sample_1_2010_04_30_run
Run20100430_H2O-2       PCR water 2     Lab 1   sink    Lab 1   PCR_water_sample_2_2010_04_30_run
Run20100430_H2O-3       PCR water 3     Lab 1   sink    Lab 1   PCR_water_sample_3_2010_04_30_run
BB2    Spodosol 1    Soil    source    88_Soils    NA
IT2    Spodosol 2    Soil    source    88_Soils    NA
CL3    Ultisol     Soil    source    88_Soils    NA
OTU表
示例文件:data/otus.txt
QIIME导出biom后的经典表格格式:行为OTU编号,列为样本名,矩阵对应为原始测序数量
# QIIME-formatted OTU table
#OTU ID Run20100430_ESC_C-1ss   Run20100430_ESC_C-2ss   Run20100430_ESC_C-3ss   Run20100430_ESC_C-4ss   Run20100430_ESC_C-5ss
1       0       0       0       0       0       0       0       0       0       0       0       0       0       0       0
6       0       0       0       0       0       0       0       0       0       0       0       0       0       0       0
7       0       0       0       0       0       0       0       0       0       0       0       0       0       0       0
8       0       0       0       0       0       0       0       0       0       0       0       0       0       0       0
12      0       0       0       0       0       0       0       0       0       0       0       0       0       0       0
16      0       0       0       0       0       0       0       0       0       0       0       0       0       0       0
17      0       0       0       0       0       0       0       0       0       0       0       0       0       0       0
代码中文解读
# This runs SourceTracker on the original "contamination" data set
# (data included in 'data' folder)

# load sample metadata
metadata <- read.table('data/metadata.txt',sep='\t',h=T,row.names=1,check=F,comment='')

# load OTU table
# This 'read.table' command is designed for a
# QIIME-formatted OTU table.
# namely, the first line begins with a '#' sign
# and actually _is_ a comment; the second line
# begins with a '#' sign but is actually the header
# 读取行、列名,跳过一行,注释为空即读#号行
otus <- read.table('data/otus.txt',sep='\t', header=T,row.names=1,check=F,skip=1,comment='')
# 读入数据框变矩阵,且转置为样本为行的旧格式
otus <- t(as.matrix(otus))

# extract only those samples in common between the two tables
common.sample.ids <- intersect(rownames(metadata), rownames(otus))
otus <- otus[common.sample.ids,]
metadata <- metadata[common.sample.ids,]
# double-check that the mapping file and otu table
# had overlapping samples
# 判断是否存在共有样品,否则退出
if(length(common.sample.ids) <= 3) {
    message <- paste(sprintf('Error: there are %d sample ids in common ',length(common.sample.ids)),
                    'between the metadata file and data table')
    stop(message)
}

# extract the source environments and source/sink indices
# 筛选哪些是来源或目标真假T/F,which转化为位置编号
# 共筛选训练集180个,测试集125个
train.ix <- which(metadata$SourceSink=='source')
test.ix <- which(metadata$SourceSink=='sink')
# 测试集太多,只保留6个样品做演示
test.ix = head(test.ix)
envs <- metadata$Env
# 判断是否存在Description列,存在列保存于desc
if(is.element('Description',colnames(metadata))) desc <- metadata$Description

# load SourceTracker package
# 加载软件包
source('src/SourceTracker.r')

# tune the alpha values using cross-validation (this is slow!)
# 使用交叉验证调整alpha值,非常耗时
# tune.results <- tune.st(otus[train.ix,], envs[train.ix])
# alpha1 <- tune.results$best.alpha1
# alpha2 <- tune.results$best.alpha2
# note: to skip tuning, run this instead:
# 跳过优化alpha值步骤,直接设置为0.001继续计算
alpha1 <- alpha2 <- 0.001

# train SourceTracker object on training data
# 基于训练集和对应描述获得预测模型
st <- sourcetracker(otus[train.ix,], envs[train.ix])

# Estimate source proportions in test data
# 估计测试集中来源比例
results <- predict(st,otus[test.ix,], alpha1=alpha1, alpha2=alpha2)

# Estimate leave-one-out source proportions in training data
# 在训练集中留一法(一种交叉验证方法)估计来源比例,计算次数等于训练集样本数量,极耗时
# results.train <- predict(st, alpha1=alpha1, alpha2=alpha2)

# plot results
# 结果绘图, 将环境和描述列合并作为标签展示
labels <- sprintf('%s %s', envs,desc)
# 绘制饼形图比例
plot(results, labels[test.ix], type='pie')

# other plotting functions
plot(results, labels[test.ix], type='bar')
plot(results, labels[test.ix], type='dist')
# plot(results.train, labels[train.ix], type='pie')
# plot(results.train, labels[train.ix], type='bar')
# plot(results.train, labels[train.ix], type='dist')

# plot results with legend
# 添加图例,并人工指定颜色
plot(results, labels[test.ix], type='pie', include.legend=TRUE, env.colors=c('#47697E','#5B7444','#CC6666','#79BEDB','#885588'))
plot(results, labels[test.ix], type='pie', include.legend=TRUE, env.colors=rainbow(5))
最后结果绘图,可选饼形图(pie)、柱状图(bar)和堆叠图(dist),如上面示例所示。


