
我们知道没有一个细胞是孤立的,而细胞之间的交流又不能打电话,所以相对位置对细胞的分化发育起着极其重要的作用。在生命的早期,单个细胞的命运是由其位置决定的。长期以来,由于技术的限制我们很难高通量地同时获得组织中的位置信息及其状态。2019年以来,这种情况借助高通量技术得到了商业化的解决。
今天我们就以10X-Visium,我们来看看在scanpy中如何分析空间转录组数据。其实分析的框架依然是质控-降维-分群-差异分析-markergene。
要运行一套教程前提是要有相应的软件和示例数据,这里我们已经下载安装好了。就直接开始了。
import scanpy as sc
import numpy as np
import scipy as sp
import pandas as pd
import matplotlib.pyplot as plt
import matplotlib.image as mpimg
from matplotlib import rcParams
import seaborn as sb

import SpatialDE

# =============================================================================
# sc.datasets.visium_sge(sample_id='V1_Breast_Cancer_Block_A_Section_1')
# =============================================================================
plt.rcParams['figure.figsize']=(8,8)
sc.settings.verbosity = 3             # verbosity: errors (0), warnings (1), info (2), hints (3)
sc.logging.print_versions()
sc.settings.set_figure_params(dpi=80)
scanpy==1.4.7.dev29+g2a16436e
anndata==0.7.1
umap==0.3.10
numpy==1.18.2
scipy==1.3.1
pandas==0.25.1
scikit-learn==0.21.3
statsmodels==0.10.1
python-igraph==0.8.0
读入数据:
adata  = sc.read_visium("E:\\learnscanpy\\data\\V1_Breast_Cancer_Block_A_Section_1_spatial")
reading E:\learnscanpy\data\V1_Breast_Cancer_Block_A_Section_1_spatial\filtered_feature_bc_matrix.h5

Variable names are not unique. To make them unique, call `.var_names_make_unique`.
 (0:00:01)
Variable names are not unique. To make them unique, call `.var_names_make_unique`.

adata.var_names_make_unique()

adata
Out[9]:
AnnData object with n_obs × n_vars = 3813 × 33538
    obs: 'in_tissue', 'array_row', 'array_col'
    var: 'gene_ids', 'feature_types', 'genome'
    uns: 'images', 'scalefactors'
    obsm: 'X_spatial'

adata.obs
Out[10]:
                    in_tissue  array_row  array_col
AAACAAGTATCTCCCA-1          1         50        102
AAACACCAATAACTGC-1          1         59         19
AAACAGAGCGACTCCT-1          1         14         94
AAACAGGGTCTATATT-1          1         47         13
AAACAGTGTTCCTGGG-1          1         73         43
                      ...        ...        ...
TTGTTGTGTGTCAAGA-1          1         31         77
TTGTTTCACATCCAGG-1          1         58         42
TTGTTTCATTAGTCTA-1          1         60         30
TTGTTTCCATACAACT-1          1         45         27
TTGTTTGTGTAAATTC-1          1          7         51

[3813 rows x 3 columns]
大家肯定想知道这个路径放的是什么:
os.listdir("E:\\learnscanpy\\data\\V1_Breast_Cancer_Block_A_Section_1_spatial")
Out[13]:
['filtered_feature_bc_matrix.h5',
 'pnas.1912459116.sd12.csv',
 'pnas.1912459116.sd12_1.csv',
 'pnas.1912459116.sd15.xlsx.xlsx',
 'spatial']
预处理与质控
sc.pl.highest_expr_genes(adata, n_top=20)
mito_genes = adata.var_names.str.startswith('MT-')
# for each cell compute fraction of counts in mito genes vs. all genes
# the `.A1` is only necessary as X is sparse (to transform to a dense array after summing)
adata.obs['mt_frac'] = np.sum(
    adata[:, mito_genes].X, axis=1).A1 / np.sum(adata.X, axis=1).A1
# add the total counts per cell as observations-annotation to adata
adata.obs['total_counts'] = adata.X.sum(axis=1).A1

adata
AnnData object with n_obs × n_vars = 3813 × 33538
    obs: 'in_tissue', 'array_row', 'array_col', 'mt_frac', 'total_counts'
    var: 'gene_ids', 'feature_types', 'genome'
    uns: 'images', 'scalefactors'
    obsm: 'X_spatial'
adata.uns['images']['hires'][1]
Out[24]:
array([[0.7490196 , 0.7529412 , 0.7411765 ],
       [0.74509805, 0.75686276, 0.7411765 ],
       [0.7490196 , 0.75686276, 0.7411765 ],
       ...,
       [0.7529412 , 0.75686276, 0.74509805],
       [0.7490196 , 0.75686276, 0.7411765 ],
       [0.7490196 , 0.7607843 , 0.7411765 ]], dtype=float32)

adata.obsm['X_spatial']

Out[25]:
array([[17428, 15937],
       [ 6092, 18054],
       [16351,  7383],
       ...,
       [ 7594, 18294],
       [ 7190, 14730],
       [10484,  5709]], dtype=int64)

adata.uns['scalefactors']
Out[26]:
array([[0.7490196 , 0.7529412 , 0.7411765 ],
       [0.74509805, 0.75686276, 0.7411765 ],
       [0.7490196 , 0.75686276, 0.7411765 ],
       ...,
       [0.7529412 , 0.75686276, 0.74509805],
       [0.7490196 , 0.75686276, 0.7411765 ],
       [0.7490196 , 0.7607843 , 0.7411765 ]], dtype=float32)Out[27]:
{'spot_diameter_fullres': 177.4829519178534,
 'tissue_hires_scalef': 0.08250825,
 'fiducial_diameter_fullres': 286.7032300211478,
 'tissue_lowres_scalef': 0.024752475}
fig, axs = plt.subplots(1,2, figsize=(15,4))
fig.suptitle('Covariates for filtering')
sb.distplot(adata.obs['total_counts'], kde=False, ax = axs[0])
sb.distplot(adata.obs['total_counts'][adata.obs['total_counts']<10000], kde=False, bins=40, ax = axs[1])
sc.pp.filter_cells(adata, min_counts = 5000)
print(f'Number of cells after min count filter: {adata.n_obs}')
sc.pp.filter_cells(adata, max_counts = 35000)
print(f'Number of cells after max count filter: {adata.n_obs}')
adata = adata[adata.obs['mt_frac'] < 0.2]
print(f'Number of cells after MT filter: {adata.n_obs}')
sc.pp.filter_cells(adata, min_genes = 3000)
print(f'Number of cells after gene filter: {adata.n_obs}')
sc.pp.filter_genes(adata, min_cells=10)
print(f'Number of genes after cell filter: {adata.n_vars}')

filtered out 518 cells that have less than 5000 counts
Number of cells after min count filter: 3295
filtered out 357 cells that have more than 35000 counts
Number of cells after max count filter: 2938
Number of cells after MT filter: 2938
filtered out 215 cells that have less than 3000 genes expressed
Trying to set attribute `.obs` of view, copying.
Number of cells after gene filter: 2723
filtered out 15551 genes that are detected in less than 10 cells
Number of genes after cell filter: 17987
降维聚类
sc.pp.normalize_total(adata, inplace = True)
sc.pp.log1p(adata)
sc.pp.highly_variable_genes(adata, flavor='seurat', n_top_genes=2000, inplace=True)
sc.pp.pca(adata, n_comps=50, use_highly_variable=True, svd_solver='arpack')
sc.pp.neighbors(adata)

sc.tl.umap(adata)
sc.tl.leiden(adata, key_added='clusters')
adata
Out[45]:
AnnData object with n_obs × n_vars = 2723 × 17987
    obs: 'in_tissue', 'array_row', 'array_col', 'mt_frac', 'total_counts', 'n_counts', 'n_genes', 'clusters'
    var: 'gene_ids', 'feature_types', 'genome', 'n_cells', 'highly_variable', 'means', 'dispersions', 'dispersions_norm'
    uns: 'images', 'scalefactors', 'log1p', 'pca', 'neighbors', 'umap', 'leiden'
    obsm: 'X_spatial', 'X_pca', 'X_umap'
    varm: 'PCs'
    obsp: 'distances', 'connectivities'
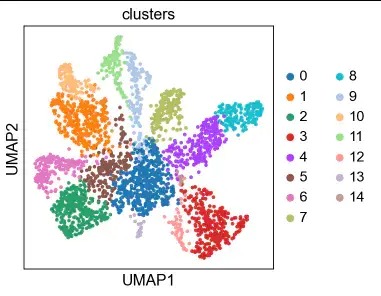
sc.tl.umap(adata)
sc.pl.umap(adata, color='clusters', palette=sc.pl.palettes.default_20)
可视化空间信息
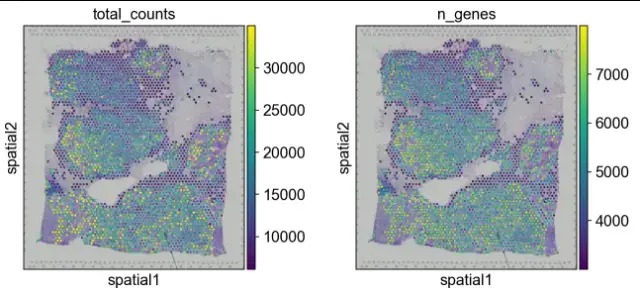
sc.pl.spatial(adata, img_key = "hires",color=['total_counts', 'n_genes'])
sc.pl.spatial(adata, img_key = "hires", color="clusters", size=1.5)
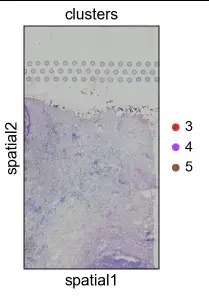
sc.pl.spatial(adata, img_key = "hires", color="clusters", groups = ['3',"4","5"], crop_coord = [1200,1700,1900,1000], alpha = .5, size = 1.3)
差异分析
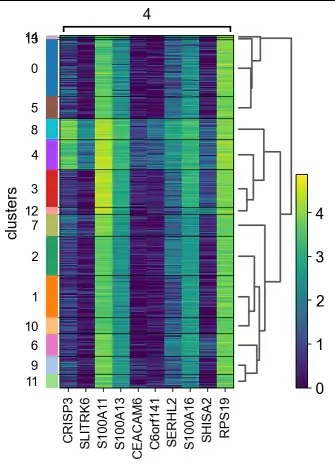
sc.tl.rank_genes_groups(adata, "clusters", inplace = True)
sc.pl.rank_genes_groups_heatmap(adata, groups = "4", groupby = "clusters", show = False)
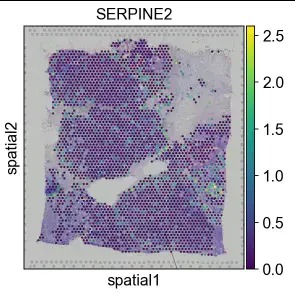
sc.pl.spatial(adata, img_key = "hires", color="SERPINE2")
空间高变基因
空间转录组学允许研究人员调查基因表达趋势如何在空间上变化,从而确定基因表达的空间模式。为此,我们使用SpatialDE (paper - code),这是一个基于高斯过程的统计架构,旨在识别空间变异基因。
counts = pd.DataFrame(adata.X.todense(), columns=adata.var_names, index=adata.obs_names)
coord = pd.DataFrame(adata.obsm["X_spatial"], columns=["x_coord", "y_coord"], index = adata.obs_names)
results = SpatialDE.run(coord, counts)
results.index = results["g"]
adata.var = pd.concat([adata.var, results.loc[adata.var.index.values,:]], axis = 1)
results.sort_values("qval").head(10)
SpatialDE是一种以非线性和非参数的方式识别明显依赖空间坐标的基因的方法。预期的应用是空间解析的rna测序,如空间转录组学,或原位基因表达测量,如SeqFISH或MERFISH。文章发表在SpatialDE: identification of spatially variable genes
技术进步使得在高通量下测量空间分辨基因表达成为可能。然而,分析这些数据的方法还没有建立。在这里,我们描述SpatialDE,这是一种从多路成像或空间rna测序数据中识别具有表达变异空间模式的基因的统计测试。SpatialDE还实现了“自动表达组织学”,这是一种空间基因聚类方法,支持基于表达的组织学。
此外,SpatialDE提供了自动表达组织学,这是一种将基因分组成常见空间模式的方法(并根据基因共表达反过来显示组织模式)。这个存储库包含我们的方法的实现,以及应用它的案例研究。我们的方法的主要特点是:
无监督-不需要定义空间区域 非参数和非线性的表达式模式 基于空间共表达基因的自动组织学 非常快-在正常的计算机上,转录组只需要几分钟
很遗憾,并没有那么快:
counts = pd.DataFrame(adata.X.todense(), columns=adata.var_names, index=adata.obs_names)
coord = pd.DataFrame(adata.obsm["X_spatial"], columns=["x_coord", "y_coord"], index = adata.obs_names)
results = SpatialDE.run(coord, counts)
results.index = results["g"]
adata.var = pd.concat([adata.var, results.loc[adata.var.index.values,:]], axis = 1)
results.sort_values("qval").head(10)
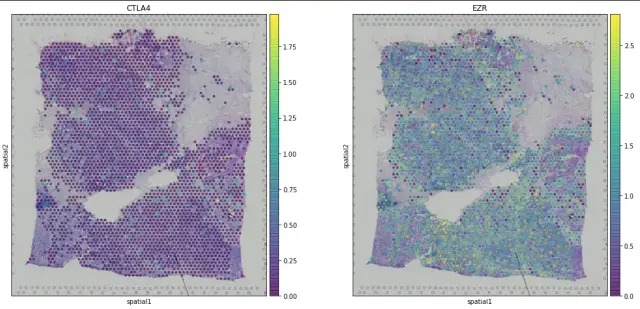
sc.pl.spatial(adata,img_key = "hires",color = ["CTLA4", "EZR"], alpha = 0.7)
MERFISH example
In case you have spatial data generated with FISH-based techniques, just read the cordinate table and assign it to the adata.obsm element.
Let’s see an example from Xia et al. 2019.
coordinates = pd.read_excel("E:\\learnscanpy\\\data\\V1_Breast_Cancer_Block_A_Section_1_spatial/pnas.1912459116.sd15.xlsx.xlsx", index_col = 0)
counts = sc.read_csv("E:\\learnscanpy\\\data\\V1_Breast_Cancer_Block_A_Section_1_spatial/pnas.1912459116.sd12_1.csv",first_column_names= True) # .transpose()
counts.to_df()

# =============================================================================
# pdcounts = pd.read_csv("E:\\learnscanpy\\\data\\V1_Breast_Cancer_Block_A_Section_1_spatial/pnas.1912459116.sd12.csv").transpose()
# pdcounts.fillna(0).to_csv("E:\\learnscanpy\\\data\\V1_Breast_Cancer_Block_A_Section_1_spatial/pnas.1912459116.sd12_1.csv",header=0)
#
# pdcounts.dropna(axis=1, how='all')
# pdcounts.dropna(axis=1, how='any')
# pdcounts["ACE"]
#
# pdcounts
# pdcounts
# pdcounts
#
#
#
# help(sc.read_csv)
#
# counts.index
# counts['B1_cell4':]
# from sklearn import datasets
# counts.loc[coordinates.index,:]
#
# iris = datasets.load_iris()
# X = iris.data
# y = iris.target
# type(X)
# str(X)
#
#
# clf=KMeans(n_clusters=3)
# model=clf.fit(X)
# =============================================================================

coordinates.index)

adata_merfish = counts[coordinates.index,:]
adata_merfish.obsm["X_spatial"] = coordinates.to_numpy()

sc.pp.normalize_per_cell(adata_merfish, counts_per_cell_after=1e6)
sc.pp.log1p(adata_merfish)

sc.pp.pca(adata_merfish, n_comps=15)
sc.pp.neighbors(adata_merfish)
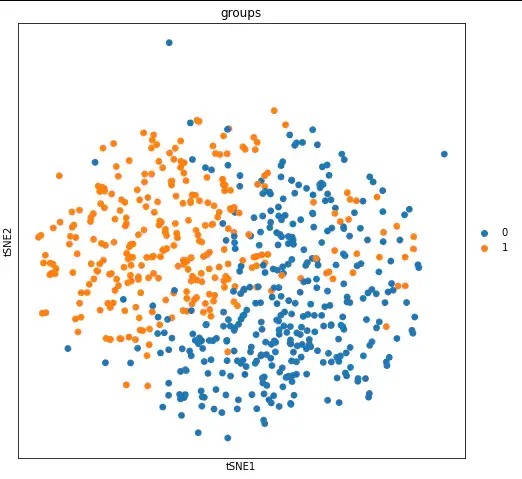
sc.tl.leiden(adata_merfish, key_added='groups', resolution=0.5)

sc.tl.tsne(adata_merfish, perplexity = 100,  n_jobs=12)
sc.pl.tsne(adata_merfish, color = "groups")
adata_merfish
Out[111]:
AnnData object with n_obs × n_vars = 645 × 94
    obs: 'n_counts', 'groups'
    uns: 'log1p', 'pca', 'neighbors', 'leiden', 'groups_colors'
    obsm: 'X_spatial', 'X_pca', 'X_tsne'
    varm: 'PCs'
    obsp: 'distances', 'connectivities'
References
[1] 10X空间转录组Visium:基本概念: https://www.jianshu.com/p/b030e3438d4b[2] 10X空间转录组Visium || 空间位置校准: https://www.jianshu.com/p/91aec69ee277[3] Visium: https://www.10xgenomics.com/spatial-transcriptomics/[4] SpatialDE: identification of spatially variable genes: https://www.nature.com/articles/nmeth.4636[5] Xia et al. 2019: https://www.pnas.org/content/116/39/19490.abstract[6] https://scanpy-tutorials.readthedocs.io/en/latest/analysis-visualization-spatial.html


